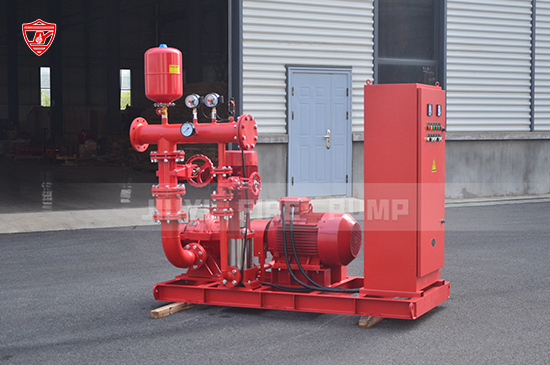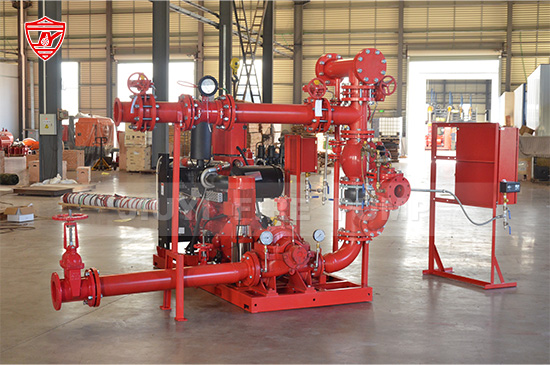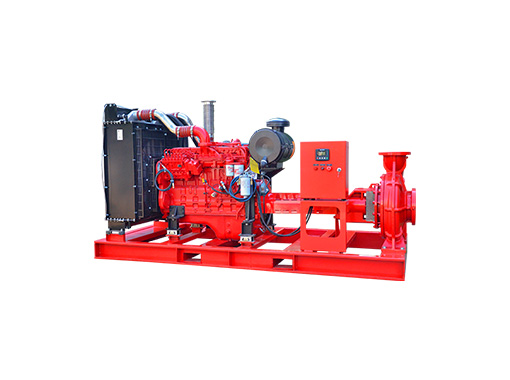
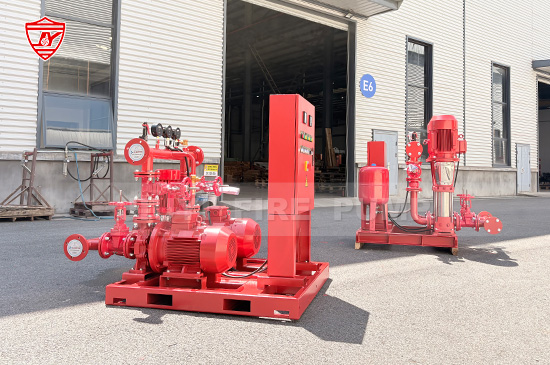
A fire pump performance curve is one of the most important technical documents to understand when selecting, specifying, installing, or testing a fire pump. It shows how a pump performs under different operating conditions and helps fire protection professionals determine whether the pump can deliver the required flow and pressure for a specific fire protection system.
For engineers, contractors, distributors, and facility owners, knowing how to read a fire pump performance curve can prevent incorrect pump selection, insufficient system pressure, and unexpected performance problems during commissioning or testing.
A fire pump may have a high rated flow or pressure, but that does not necessarily mean it will perform correctly in every fire protection application. The relationship between flow and pressure is what matters. The performance curve provides a visual representation of this relationship.
In this guide, we will explain what a fire pump performance curve is, how to read it, which key points to look for, and how to use the curve when selecting a fire pump.
A fire pump performance curve, sometimes called a fire pump curve or performance chart, is a graph that illustrates the relationship between the flow rate produced by a fire pump and the pressure or head generated by the pump.
In most cases, the horizontal axis represents flow, while the vertical axis represents pressure or head.
As the flow increases, the pressure produced by a centrifugal fire pump generally decreases. At zero flow, the pump develops its maximum pressure, known as the shutoff pressure or churn pressure. As water demand increases, the pump supplies more flow, but the available pressure decreases along the performance curve.
This basic relationship is essential for understanding whether a fire pump can meet the hydraulic requirements of a fire protection system.
A typical performance curve may also show additional information, including:
The exact information shown depends on the pump type, manufacturer, certification requirements, and the intended application.
The horizontal axis of a typical fire pump performance curve represents the flow rate.
Flow is commonly expressed in units such as:
For example, a fire pump may be rated at 500 GPM, 1,000 GPM, or 1,500 GPM.
The rated flow is an important specification because the fire protection system is designed around a required water demand. However, the rated flow should not be considered in isolation.
A pump rated at 1,000 GPM does not necessarily deliver exactly 1,000 GPM in every operating condition. The actual flow depends on system demand and other factors, including piping resistance, elevation, valves, fittings, and pressure requirements.
When reading the performance curve, always identify the flow rate required by the fire protection system and then determine the pressure the pump can provide at that flow.
The vertical axis normally represents the pressure or head produced by the pump.
Depending on the region and manufacturer, pressure may be expressed in:
Pressure and head are closely related, but they are not exactly the same measurement. Pump head represents the energy added to the water, while pressure is the force exerted by the water.
For fire pump selection, it is important to understand which measurement is used on the manufacturer's performance curve.
For example, a curve may show that a pump produces a certain pressure at its rated flow. This pressure must be sufficient to overcome the requirements of the fire protection system, including friction losses, elevation differences, and the minimum pressure required at the most hydraulically demanding sprinkler or hose outlet.
The rated point is one of the most important points on a fire pump performance curve.
It represents the pump's rated capacity and rated pressure. For example, a pump may be identified as:
1,000 GPM at 120 PSI
This means the pump is rated to provide 1,000 gallons per minute at a rated pressure of 120 PSI under the specified conditions.
When reviewing a fire pump curve, locate the rated flow on the horizontal axis and move vertically until you reach the pump curve. Then move horizontally toward the pressure axis to determine the corresponding pressure.
The rated point provides a reference for evaluating whether the pump is suitable for the system's design requirements.
However, a proper pump selection should also consider the complete performance curve rather than focusing only on the rated point.
Churn pressure is the pressure generated by the fire pump when there is little or no water flowing through the pump.
It is also commonly referred to as shutoff pressure.
On a typical fire pump performance curve, this is located near the left side of the graph, where the flow approaches zero.
Churn pressure is usually higher than the rated pressure. This is because centrifugal pumps generally produce their highest pressure when operating at or near zero flow.
Understanding churn pressure is important because excessive pressure at low flow can affect fire protection system components. Valves, piping, sprinklers, fittings, and other components must be suitable for the maximum pressures that may occur in the system.
When selecting a fire pump, engineers should consider not only the required operating pressure but also the pressure that the pump can generate under churn conditions.
A common point shown on fire pump performance curves is 150% of rated flow.
For example, if a pump has a rated capacity of 1,000 GPM, 150% of rated flow would be 1,500 GPM.
The pressure available at this higher flow point provides useful information about the pump's performance and capacity.
As flow increases, pump pressure normally decreases. Therefore, the pressure at 150% of rated flow is typically lower than the rated pressure.
This point is particularly useful when evaluating the overall operating range of a fire pump. It helps engineers understand how the pump behaves when system demand is higher than the nominal rated flow.
A pump should not be selected based only on its rated capacity. The entire curve should be reviewed to understand how pressure changes as the flow demand changes.
Reading a fire pump performance curve becomes much easier when you follow a systematic process.
First, determine the required flow rate for the fire protection system.
This information normally comes from the hydraulic calculation or system design. Depending on the application, the required flow may be based on sprinkler demand, standpipe demand, hose stream allowance, or other fire protection requirements.
For example, suppose the system requires 1,000 GPM.
Locate 1,000 GPM on the horizontal axis of the performance curve.
From the required flow point, move vertically upward until you intersect the pump performance curve.
Then move horizontally toward the pressure axis.
The resulting value represents the approximate pressure the pump can provide at that flow.
If the pressure is insufficient for the system requirements, the pump may not be suitable.
Next, locate the pump's rated flow and rated pressure.
Confirm that the pump's rated point corresponds appropriately with the system's design requirements.
For example, if the system requires 1,000 GPM at a specific pressure, check whether the selected pump can provide the required pressure at 1,000 GPM.
Look at the left side of the curve to identify the pressure at zero or near-zero flow.
This is the churn or shutoff pressure.
Compare this pressure with the maximum allowable working pressure of the fire protection system components.
Finally, review the curve at higher flow rates.
Determine how much pressure the pump can provide at 150% of rated flow or another relevant operating point.
This helps confirm that the pump has an appropriate performance range for the application.
One common mistake is to select a fire pump based only on a single pressure value.
For example, a buyer may look at a pump described as "100 PSI" and assume that the pump will always provide 100 PSI.
In reality, the pressure produced by a centrifugal fire pump changes depending on the flow rate.
At low flow, the pressure may be higher than the rated pressure. At the rated flow, the pressure reaches the rated value. At higher flow, the pressure generally decreases.
Therefore, the complete performance curve provides much more information than a single pressure specification.
This is why engineers and fire protection professionals should always review the pump curve when selecting a fire pump.
The purpose of fire pump selection is to ensure that the pump can meet the hydraulic requirements of the system.
A proper evaluation should consider:
The pump curve should be evaluated together with the system's hydraulic calculations.
For example, a building may require a specific flow at the hydraulically most remote sprinkler. The pump must provide enough pressure to overcome the pressure losses between the pump and that location.
If the pump is undersized, the system may not achieve the required pressure.
If the pump is significantly oversized, the system may experience excessive pressure and unnecessary costs.
The objective is to select a pump that provides reliable performance across the expected operating range.
Both electric fire pumps and diesel engine fire pumps are commonly used in fire protection systems, but their performance must be evaluated according to their specific configurations.
For an electric fire pump, the performance curve is associated with the pump and its electric motor operating at the specified speed and conditions.
For a diesel engine fire pump, the available performance also depends on the diesel engine, rated speed, and overall pump-and-driver combination.
When reviewing a diesel fire pump set, it is important to confirm that the engine provides sufficient power throughout the required operating range.
For packaged fire pump systems, the performance of the complete system should be considered, including the main fire pump, driver, controller, and associated components.
A fire pump performance curve shows what the pump can provide.
A system curve represents what the fire protection system requires at different flow rates.
The intersection between the pump curve and the system demand curve represents an operating point.
This concept is important because a pump does not operate at one fixed flow and pressure under every condition. Its actual operating point depends on the interaction between pump performance and system demand.
For this reason, selecting a fire pump requires more than simply comparing a pump's rated pressure with the system's required pressure.
The pump must operate appropriately within the system's expected range.
Several mistakes can lead to incorrect fire pump selection.
A pump's rated pressure is only one point on the curve. Always review the full performance range.
High pressure at zero flow can affect system components. Churn pressure should always be considered.
A pump that performs well at rated flow may not provide sufficient pressure at higher flow rates.
Make sure the units and terminology used on the curve are correctly understood.
The pump should be matched to the actual fire protection system requirements rather than selected based solely on a catalog rating.
The pump and driver must work together as a complete system. This is particularly important for diesel engine fire pump sets.
A performance curve represents expected pump performance, but testing is essential to verify actual field performance.
During fire pump testing, flow and pressure measurements can be compared with the manufacturer's expected performance data.
Testing can help identify:
Regular testing also helps confirm that the fire pump remains capable of supporting the fire protection system when needed.
The specific testing procedures and acceptance criteria should follow the applicable codes, standards, and local regulations.
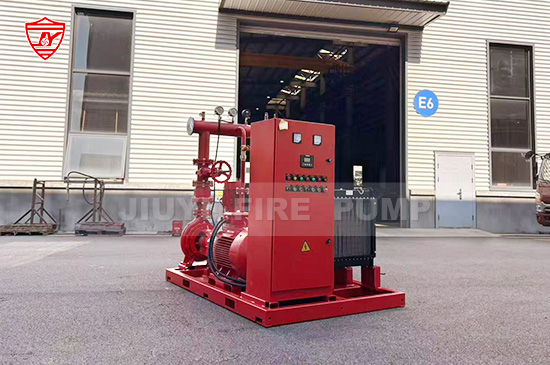
Understanding a fire pump performance curve is essential for anyone involved in fire protection system design, engineering, procurement, installation, commissioning, or maintenance.
The key is to understand the relationship between flow and pressure.
Start by identifying the required system flow. Then determine the pressure the pump can provide at that flow. After that, check the rated point, churn pressure, and high-flow performance. Finally, compare the complete pump performance with the hydraulic requirements of the fire protection system.
A properly selected fire pump should not simply meet one specification on paper. It should provide reliable performance across the operating range required by the system.